Theoretical Models Versus Industrial Operating Realities
Industrial engineering teams frequently justify capital upgrades by performing lifecycle cost evaluations comparing permanent magnet synchronous motors against standard induction machinery. In an industrial textile processing plant operating over two hundred continuous draw-twist spinning frames, financial payback projections failed to match post-commissioning utility metering by over thirty-five percent. Investigating the financial deviation revealed that theoretical calculation spreadsheets assumed steady-state nameplate efficiencies, ignoring real-world operating factors such as variable duty cycles, harmonic losses, and mechanical transmission drag. Conducting an accurate PMSM vs Induction Motor Cost analysis requires moving beyond simplified catalog formulas to account for dynamic plant operating parameters.
|
Calculation Parameter
|
Idealized Theoretical Assumption
|
Actual Industrial Operating Reality
|
|
Operational Load Factor
|
Constant 100% Full Load
|
Variable 30% - 80% Duty Cycle
|
|
Inverter Harmonic Loss
|
Zero (Assumed Pure Sinusoidal)
|
2% - 5% Additional Thermal Loss
|
|
Ambient Working Temperature
|
Standard 25°C Laboratory Base
|
40°C - 55°C Industrial Enclosure
|
|
Drivetrain Transmission Losses
|
Ignored / Excluded from Model
|
8% - 20% Belt / Reducer Friction Drag
|
Traditional capital expenditure evaluations focus heavily on initial equipment purchase prices. However, across a typical twenty-year operating lifespan, electrical energy consumption accounts for roughly ninety percent of total motor lifecycle costs, while initial purchase price accounts for only five percent. When financial analysts evaluate PMSM vs Induction Motor Cost trade-offs, relying on static nameplate metrics skews financial return models, generating significant discrepancies between projected and realized savings.
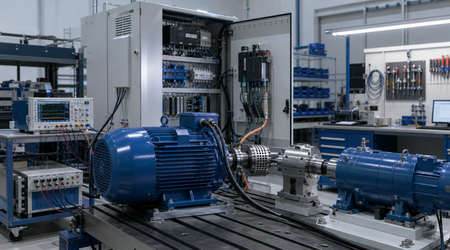
Neglect of Part-Load Efficiency Degradation Curves
Theoretical financial calculations frequently presume motors operate at constant full load throughout annual operating schedules. In actual manufacturing operations, continuous process shifts, conveyor batching, and pump throttling force motors to run at partial capacities ranging from 30 to 70 percent of rated power. Standard induction motors experience steep efficiency drops when loaded below half capacity. In contrast, permanent magnet synchronous machines maintain high efficiency across broad load profiles, meaning simplified full-load models severely underestimate PMSM financial energy savings.
Thermal Resistance Drift and High Ambient Temperatures
Standard motor test standards rate equipment performance at an ambient temperature of 25 degrees Celsius. Real-world industrial compressor rooms and factory ceilings routinely operate at temperatures exceeding 45 degrees Celsius. In induction motors, elevated temperatures increase rotor copper bar electrical resistance, driving internal I2R losses up and reducing operating efficiency. A realistic PMSM vs Induction Motor Cost evaluation must account for thermal drift, recognizing that low-temperature-rise permanent magnet motors preserve energy efficiency advantages in hot environments.
Omission of Mechanical Drivetrain Parasitic Drag
Comparing an induction motor and a permanent magnet motor solely at the motor shaft overlooks intermediate mechanical transmission losses. Many induction installations drive machinery through belts, jack shafts, or speed reducers that waste between 5 and 20 percent of total energy. Because high-torque permanent magnet motors often connect directly to driven loads, failing to incorporate avoided gearbox friction into the PMSM vs Induction Motor Cost analysis leads to substantial financial forecasting errors.
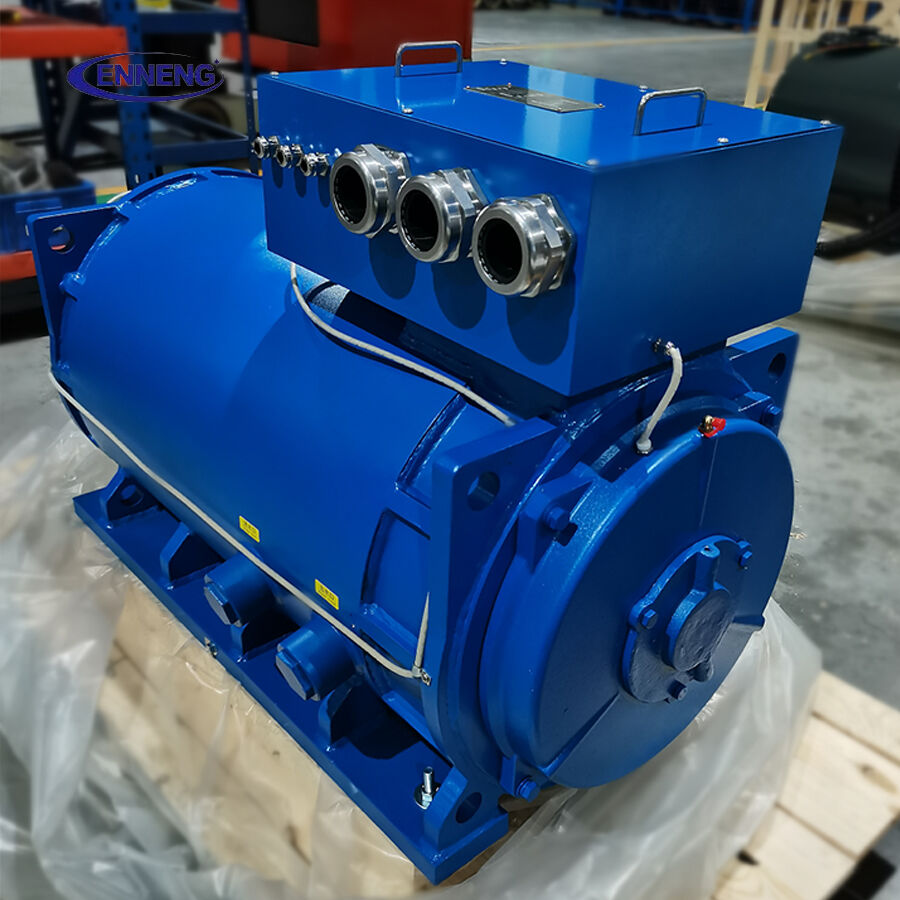
Technical Superiority and Value Engineering with ENNENG Motors
Accurate lifecycle financial evaluations highlight the substantial economic advantages of transitioning industrial operations to advanced synchronous drive technology. ENNENG manufactures high-efficiency permanent magnet motors engineered to deliver superior long-term performance across demanding operating envelopes. Integrating an ENNENG PMSM vs Induction Motor Cost model allows industrial operators to accurately quantify real-world energy savings ranging from 10 to 40 percent.
|
Cost and Performance Factor
|
Standard Industrial Induction Drive
|
ENNENG Permanent Magnet System
|
|
Real-World Energy Savings
|
Baseline Benchmark Level
|
10% - 40% Energy Reduction
|
|
Operating Power Factor
|
0.82 - 0.87 Average
|
0.95 - 0.98 Super Premium
|
|
Voltage Range Coverage
|
Rigid Standard Ratings
|
110V to 690V Unified Range
|
|
Direct Drive Gearless Potential
|
Very Limited (Requires Gearing)
|
High Low-Speed Torque Output
|
ENNENG industrial motors operate across wide voltage configurations spanning 110V to 690V, providing versatile integration for pump, fan, compressor, and mill installations. Advanced rare-earth magnetic architecture ensures high power factor operation, eliminating power factor utility surcharges and reducing distribution transformer losses.
Power Factor Surcharges and Distribution Cable Dissipation
Induction machinery draws substantial magnetizing current from utility grids, producing low power factor figures that prompt electric utilities to levy significant monthly penalty charges. Furthermore, high reactive currents increase resistive heating dissipation inside plant distribution cables and switchgear. Factoring power factor correction into the PMSM vs Induction Motor Cost calculation demonstrates that permanent magnet synchronous drives reduce corporate electrical costs on multiple financial levels.
Reduced Plant Downtime and Maintenance Avoidance
Beyond electrical energy savings, maintenance labor and lost production output represent major operational cost factors. Induction motor drive lines require frequent belt re-tensioning, bearing lubrication, and periodic motor rewinding following thermal insulation breakdown. Permanent magnet direct-drive systems run cooler and eliminate wear components, delivering maintenance cost avoidance that shortens capital payback schedules significantly.
Authoritative Standards and Lifecycle Cost Methodologies
Rigorous lifecycle costing must adhere to structured international standards rather than unverified internal spreadsheets. The International Electrotechnical Commission outlines comprehensive testing procedures for determining losses and efficiency through IEC 60034-2-1, establishing precise loss-segregation methods.
System-level electrical power quality evaluations must comply with IEEE 1459, which defines electric power calculations under sinusoidal, non-sinusoidal, balanced, and unbalanced conditions. When calculating PMSM vs Induction Motor Cost projections, engineers must account for harmonic voltage and current distortion caused by variable frequency drives, ensuring harmonic loss factors are accurately applied to lifecycle models. Furthermore, corporate financial assessments should adhere to ISO 15663 guidelines for petroleum, petrochemical, and natural gas industries, establishing formal methodologies for lifecycle cost estimation across capital procurement, energy consumption, and decommissioning phases.
Step-by-Step Guide for Accurate Financial Payback Modeling
Field Load Profiling and Empirical Duty Cycle Logging
Never rely on nameplate motor ratings to estimate operating power demand. Connect high-speed portable power data loggers to existing motor feed lines for at least one full continuous operating week. Record real-time active power (kW), current unbalance, and running load percentages across differing production shifts to establish an accurate weighted operating load profile.
Quantifying Inverter and Mechanical Transmission Efficiencies
Calculate total drivetrain system efficiency rather than standalone motor efficiency. When modeling a PMSM vs Induction Motor Cost comparison, incorporate inverter conversion efficiency (typically 97 to 98 percent) and mechanical transmission losses. If the permanent magnet alternative eliminates an existing right-angle gearbox or belt arrangement, credit the avoided transmission losses (typically 8 to 15 percent) directly to the permanent magnet financial ledger.
Integrating Escalating Electricity Tariffs and Thermal Degradation
Electricity tariffs rarely remain static over multi-year industrial horizons. Incorporate realistic annual energy cost escalation rates (typically 3 to 5 percent) into long-term net present value (NPV) formulas. Apply thermal degradation factors to induction motor models operating in hot ambient environments, recognizing that elevated stator and rotor temperatures decrease efficiency over multi-year duty runs.
For comprehensive specifications regarding super-premium motor hardware, visit the ENNENG Products Catalog and review solutions via ENNENG Drive Systems.
Plant controllers, financial analysts, and lead electrical engineers seeking calibrated lifecycle cost spreadsheets and empirical motor payback verifications are invited to submit facility operating profiles for detailed engineering analysis.
Frequently Asked Questions
Q: Why do theoretical models often overestimate induction motor efficiency?
A: Standard motor catalog ratings indicate efficiency under laboratory conditions with pure sinusoidal power at 25 degrees Celsius ambient temperature. In real-world industrial environments, harmonic distortion from inverters, phase voltage unbalance, elevated ambient temperatures, and partial-load operations cause actual induction motor efficiency to decline substantially below published ratings.
Q: How significantly do harmonic currents distort PMSM vs Induction Motor Cost calculations?
A: Variable frequency drives generate high-frequency harmonic voltages that induce additional iron and stray load losses inside motor stator cores. In a PMSM vs Induction Motor Cost evaluation, ignoring inverter harmonics leads engineers to underestimate motor heat generation and operating costs. High-efficiency permanent magnet designs mitigate harmonic losses through optimized stator slot geometries.
Q: Does eliminating intermediate mechanical transmissions reduce initial project capital requirements?
A: Yes. While a high-torque permanent magnet motor carries a higher initial purchase price than a bare induction motor, eliminating gearboxes, fluid couplings, structural baseplates, and protective belt guards substantially lowers total mechanical procurement costs. Turnkey installation labor and ongoing alignment expenses decrease, narrowing initial capital cost differentials.

 EN